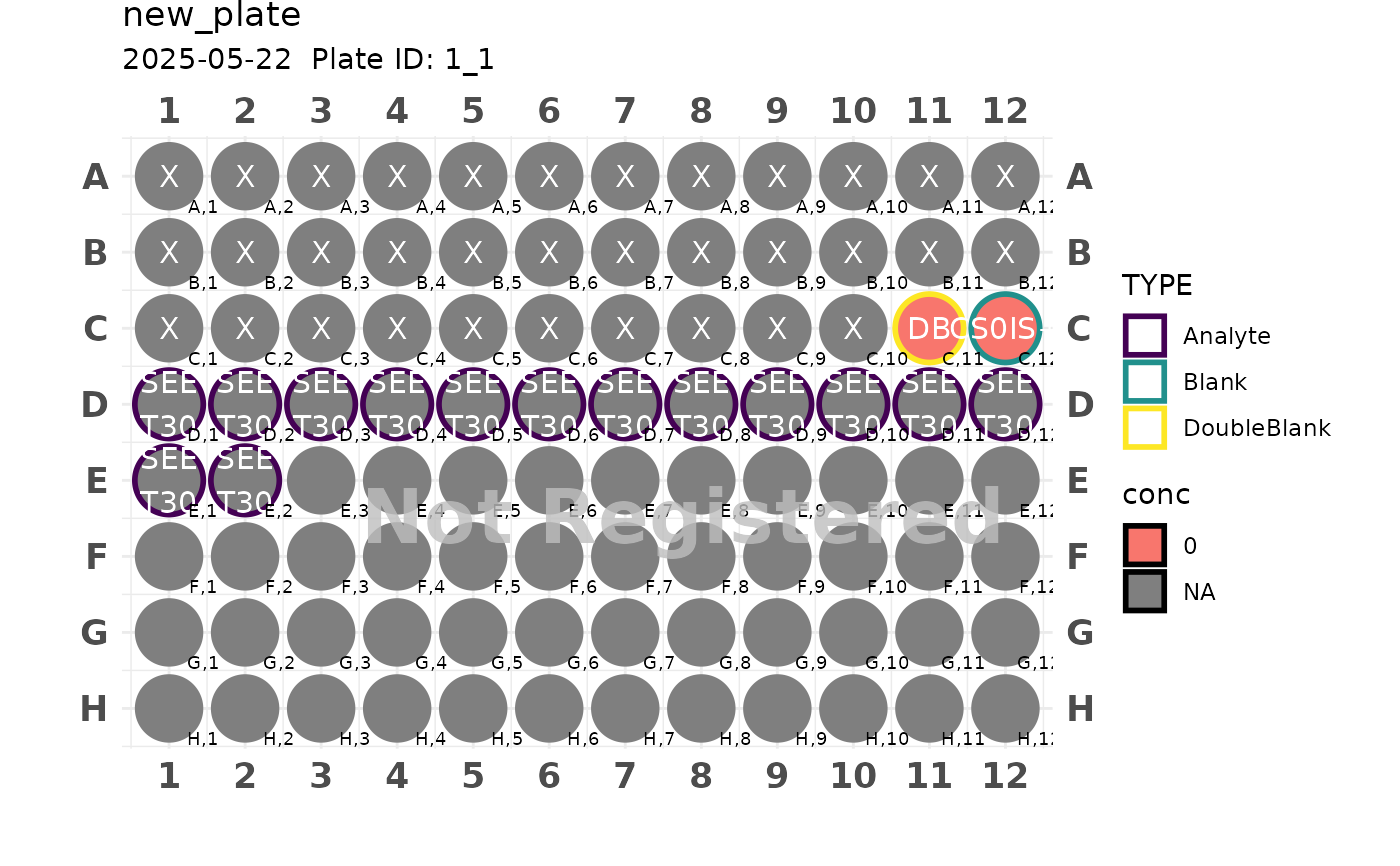
Plotting 96 well plate
Usage
# S3 method for class 'PlateObj'
plot(
  x,
  color = "conc",
  Instrument = "",
  caption = "",
  label_size = 1,
  transform_dil = FALSE,
  watermark = "auto",
  layoutOverlay = FALSE,
  path = NULL,
  ...
)
Arguments
- x
PlateObj
- color
character. Coloring variable. Choices: "conc", "group", "dil", "study", "time", "factor", "samples", "arm", "sex", "dose", "route", "matrix". Default is "conc"
- Instrument
A string placed at subtitle
- caption
A string place at plate caption
- label_size
numeric. Size of the label. Default is 15
- transform_dil
logical. If TRUE, transform the dilution factor to the label
- watermark
character. If "auto", a watermark is added to the plot. If "none", no watermark is added. Default is "auto"
- layoutOverlay
logical. If TRUE, overlay the plot layout. Default is FALSE
- path
If not null, must be a path to save plate image
- ...
additional arguments passed to ggplot2::ggsave
Examples
plate <- generate_96("new_plate", "C", 11) |>
  add_blank(IS = FALSE, analyte = FALSE) |>
  add_blank(IS = TRUE, analyte = FALSE) |>
  add_samples(c(
    "RD_per1", "RD_in1", "RD_T30", "RD_T60", "RD_T90", "RD_per2", "RD_in2",
    "EE_in0", "EE_T30", "EE_in30", "EE_T60", "EE_in60", "EE_T90", "EE_in90"
  ))
plot(plate)
#> Plate not registered. To register, use register_plate()
#> Warning: Removed 59 rows containing missing values or values outside the scale range
#> (`geom_text()`).