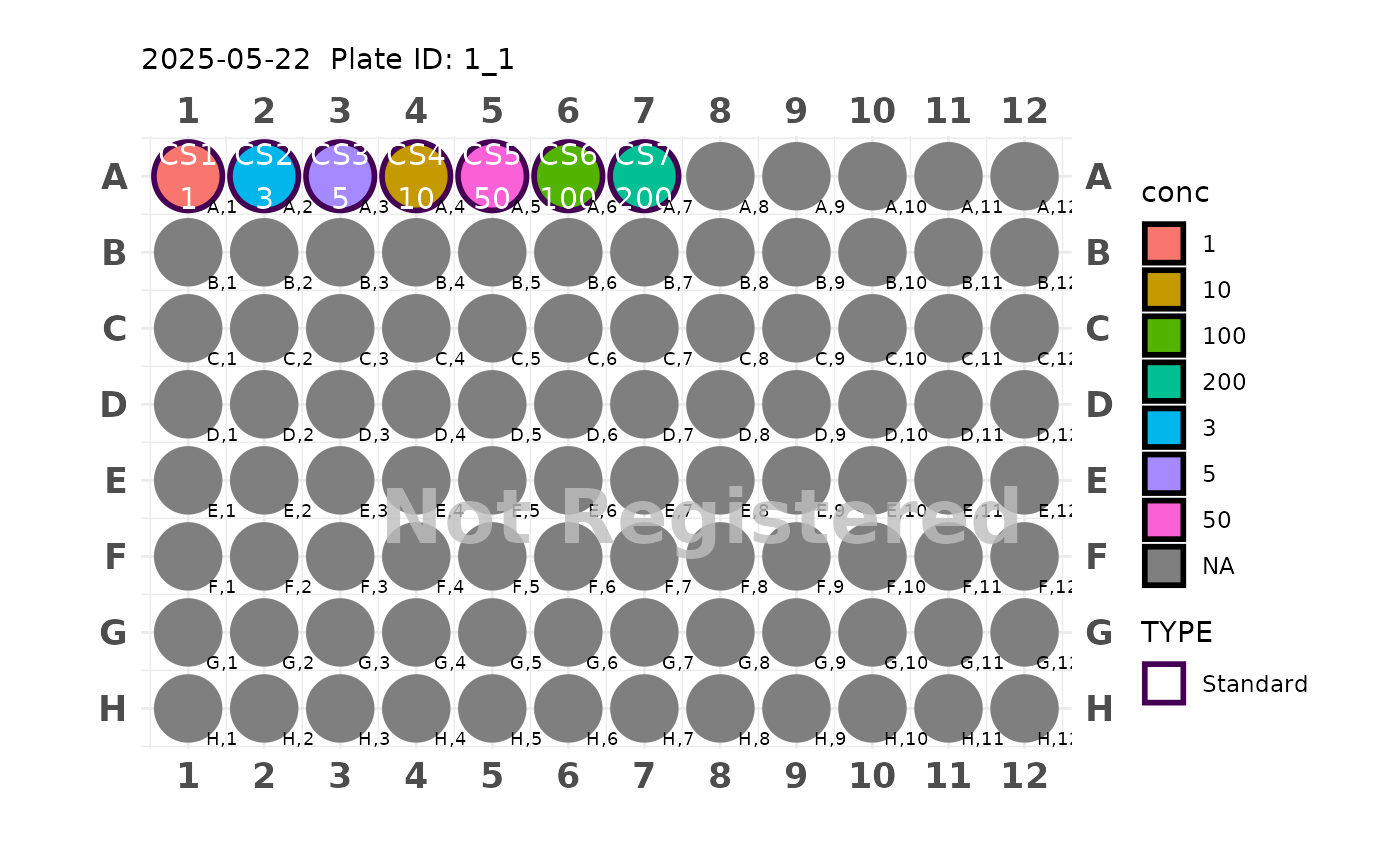
Add calibration curve to the plate
Examples
plate <- generate_96() |>
 add_cs_curve(c(1, 3, 5, 10, 50, 100, 200))
plot(plate)
#> Plate not registered. To register, use register_plate()
#> Warning: Removed 89 rows containing missing values or values outside the scale range
#> (`geom_text()`).

